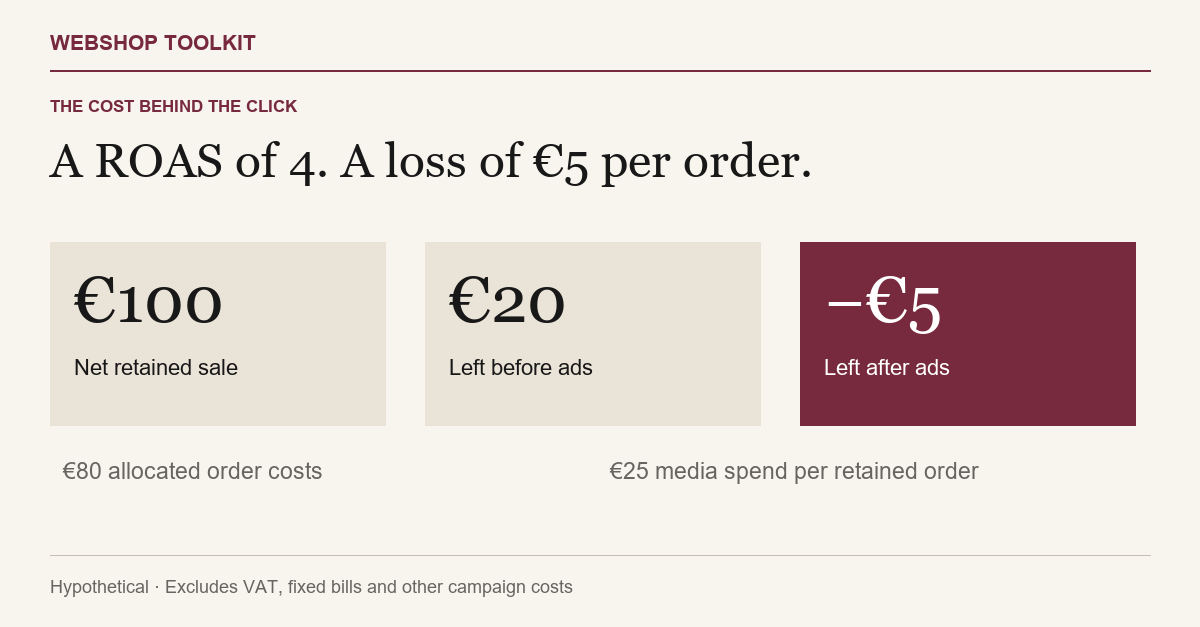
A campaign brings in €4 in sales for every €1 spent on ads. The shop can still lose €500. The missing number is what those orders leave before advertising.
The advertising report shows €10,000 in sales from €2,500 of spending. Return on ad spend: four times the money, or 400%.
It sounds like room to grow. Increase the budget, bring in more orders, repeat.
But the report has not paid the supplier. It has not covered the parcel, packing or payment fee. And it may be giving credit for sales the shop would have received anyway.
Before raising the budget, there are two questions to answer: what did these orders leave after their costs, and how much of that business did the advertising actually create?
Four euros of sales is not four euros to spend
In the usual revenue-based calculation, ROAS is attributed revenue divided by advertising spend. A result of 4 means €4 of recorded sales per €1 of advertising; it does not mean €4 of profit.
Shopify’s ROAS guide explains the revenue-to-advertising relationship. Be clear about the denominator when comparing reports: a platform’s media-spend figure and an internal calculation including creative or agency fees measure different things.
The numerator needs checking too. Google’s documentation explains that conversion values are configured by the advertiser and may represent revenue or another value. A “conversion value” column is useful only when you know what was sent into it.
For the worked example below, ROAS means net product revenue attributed to the campaign divided by media spend. We track other costs separately. It is a hypothetical shop, not a merchant case study or an industry benchmark. All amounts exclude VAT; there is no customer delivery payment in the example.
The €10,000 campaign that leaves a €500 shortfall
Imagine a campaign credited with 100 retained orders averaging €100. Revenue is measured after discounts and refunds, once the return period has matured enough to make the comparison useful.
The following costs are allocated per retained order. The returns allowance covers additional return-related costs, such as handling, unrecovered delivery and write-downs, allocated across retained sales. Refunds already removed from revenue are not deducted again. Product costs must likewise reflect recoveries rather than charging a recovered item twice.
| Per retained order | Amount |
|---|---|
| Net product revenue | €100 |
| Product cost | −€60 |
| Delivery paid by the shop | −€8 |
| Packing and variable handling | −€4 |
| Payment fees | −€3 |
| Allocated additional returns cost | −€5 |
| Contribution before advertising | €20 |
| Advertising: €2,500 ÷ 100 orders | −€25 |
| Contribution after advertising | −€5 |
Across 100 orders, the shop has €2,000 before advertising and a €2,500 media bill. That leaves a €500 shortfall before fixed bills, creative work, agency charges or other costs not included here.
The ROAS calculation is still correct: €10,000 divided by €2,500 is 4. It simply answers a narrower question than “did this campaign pay?”
The shop’s product margin is 40% before the other order costs. Its contribution margin before advertising is only 20%. Using the first percentage to set the ad budget would leave too much money available on paper.
Work backwards from what an order can afford
With €20 available before ads, this example can spend at most €20 per retained order to reach zero contribution after media spend. At €100 revenue per order, that corresponds to a revenue ROAS of 5.
The useful formula is:
Media break-even ROAS = 1 ÷ contribution margin before advertising.
Use a decimal margin: 20% becomes 0.20, so 1 ÷ 0.20 = 5. This assumes a positive contribution margin, consistent revenue definitions and a stable mix of products and costs. With zero or negative contribution before advertising, these orders provide no positive media-spend allowance. Their economics need improving before an ad target can solve the problem.
Five is not the whole business’s break-even point. It leaves nothing from those orders towards rent, software, salaries or profit. It also leaves nothing for campaign expenses outside the media bill.
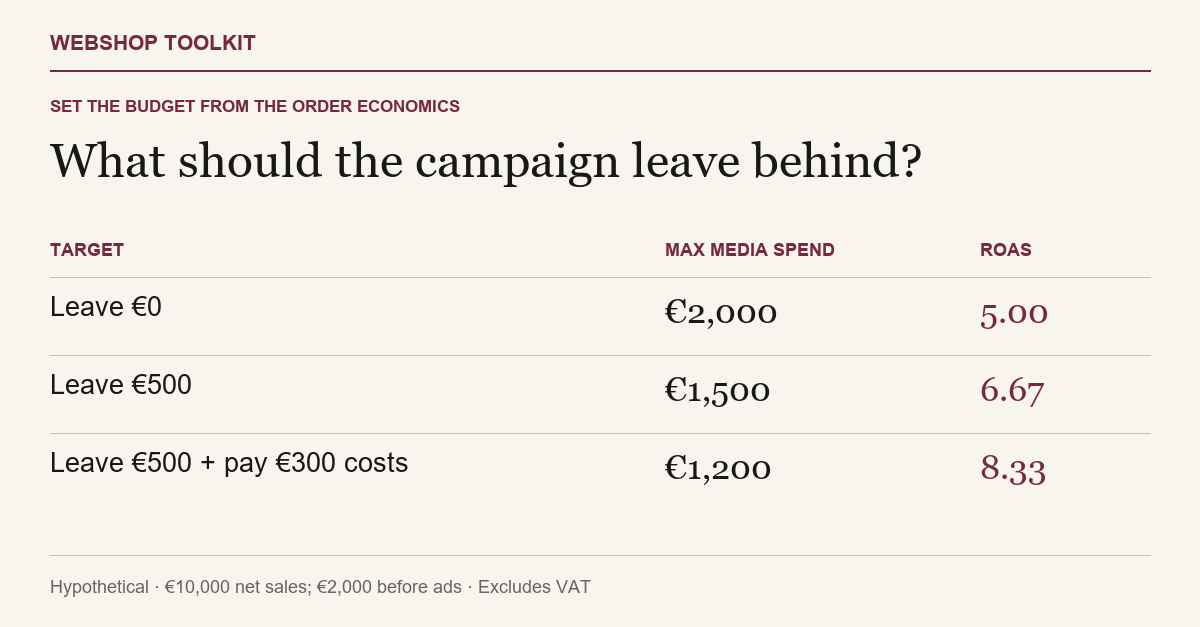
Suppose the owner wants this batch of 100 orders to leave €500 after media spending. The available ad budget is €2,000 minus €500: €1,500. The required revenue ROAS becomes €10,000 divided by €1,500, or about 6.67.
If a further €300 of creative and agency costs belongs to that batch, the media budget falls to €1,200. Required media ROAS rises to about 8.33. The same sales and order costs now have to fund another bill.
These are planning thresholds for a specified batch. They are not promises that an ad platform can deliver that volume at those returns. A stricter target may reduce delivery; more spending may reach more expensive customers. The resulting order mix needs measuring again.
The same ROAS can also make money
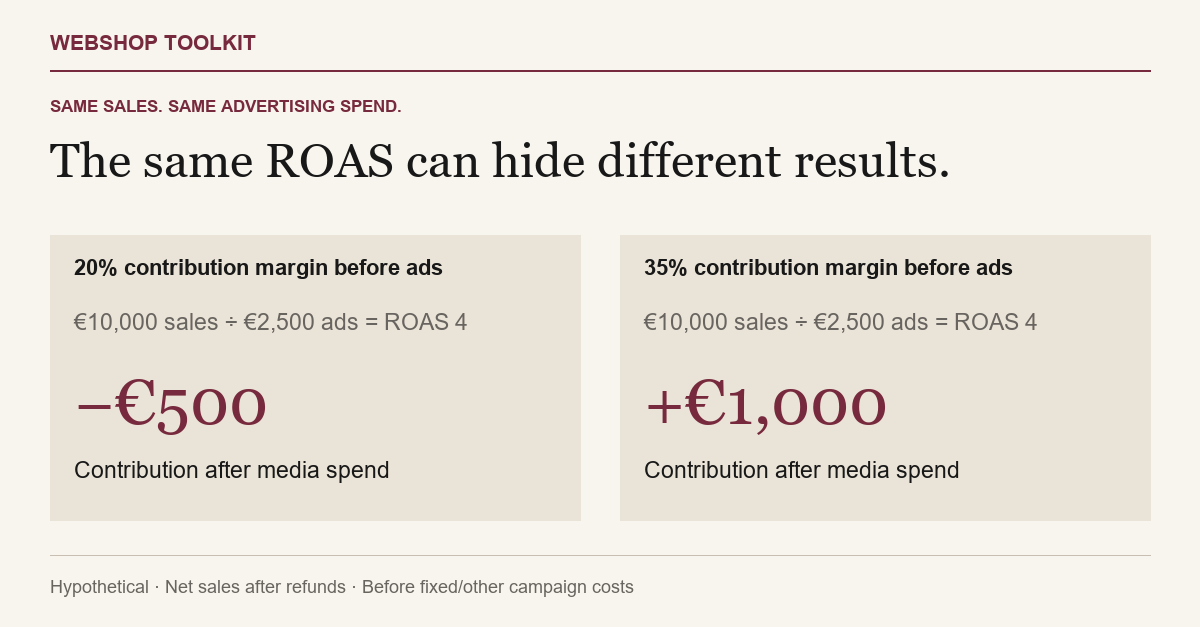
Now change just one assumption. Product cost falls from €60 to €45 per order. Everything else in the table stays the same.
Contribution before advertising rises to €35. After the same €25 advertising cost, each retained order leaves €10. Across 100 orders, that is €1,000 towards fixed bills and other costs.
Both shops have a ROAS of 4. One loses €500 after media spend; the other leaves €1,000.
That is why a “good ROAS” copied from another merchant is a poor spending rule. Even within one shop, a campaign selling bulky low-margin products may need a different threshold from one selling small accessories. A blended average can conceal a costly change in the products customers buy.
A profitable-looking batch does not prove the ads created it
There is another step between attributed revenue and a spending decision: the sales that would have happened without the advertising.
In the higher-margin example, €3,500 of contribution before advertising exceeds the €2,500 media bill. But imagine only half those orders were additional, with the same costs and basket mix, and no other effects. The additional contribution before ads would be €1,750. Against €2,500 of spending, the change would be minus €750.
This is a sensitivity calculation, not a measured incrementality result. It shows why attribution alone cannot settle the question. A platform can assign credit according to its rules without establishing the no-ad counterfactual. Brand searches, returning customers and overlapping channels deserve particular scrutiny; do not assume they are all additional or all unnecessary.
For this simplified higher-margin case, more than about 71.4% of the credited orders would need to be additional just to cover media spend: €2,500 divided by €3,500. Actual campaign effects can include product substitution, repeat purchases and sales outside the credited set, so that percentage is not a universal test.
Where feasible, use a properly designed holdout or platform experiment. Comparing an ordinary week with a promotion week can provide clues, but differences in seasonality, pricing, stock and demand can explain the change. A small shop may lack enough volume for a precise causal answer. Record that uncertainty rather than presenting attributed sales as proven lift.
Give orders time to become revenue you keep
A dashboard can look stronger before cancellations and returns have settled. Recent spending may also produce conversions later. The answer is a consistent comparison period and a clear record of how revenue and costs mature.
Google Ads supports conversion adjustments, including restating a value or retracting a conversion. That capability does not establish that a shop’s integration is already sending those adjustments. Check the actual setup and its applicable requirements.
Reconcile a mature group of orders with the advertising report: discounts, refunds, tax treatment, currency, attribution window and duplicate credit across channels. Keep any planning allowance separate from final booked costs so it is replaced, not counted twice.
Future customer value can justify spending more to acquire a customer. It also needs evidence about repeat contribution and the time it takes to arrive. Repeat revenue without its product, fulfilment and retention costs is not a spending allowance. Nor does a possible purchase next year pay today’s supplier invoice.
Before increasing the budget
Take one campaign and trace its credited sales back to retained orders. Work out what those orders leave before advertising using the actual product mix, delivery, fees and return-related costs. Then subtract media and other campaign costs once each.
Write down the contribution you want left over and the maximum spend that permits it. Finally, ask how much of the credited business you have evidence the campaign created—and what remains uncertain.
For our first shop, a ROAS of 4 is a reason to investigate a €500 shortfall. For the second, it leaves €1,000 before fixed costs. The number on the dashboard becomes useful when it is connected to the orders behind it.
Source and method notes
Researched 26 October 2026. Google help pages have no clear publication date; Shopify’s guide is dated 13 July 2026. Platform documentation establishes definitions and capabilities, not merchant profitability or our readership. The cost models, thresholds and sensitivity examples are original hypothetical calculations. No benchmark, merchant performance or personal product experience is claimed.
Related reading: The discount trap and The hidden bill for free shipping.
Join the free weekly briefing for ecommerce news and original explanations.