A customer adds €20 to avoid a delivery charge. Your shop gains €3. The customers who change nothing can decide whether the offer pays.
The basket is €50. Delivery costs another €5. Then the customer spots the message: spend €20 more and delivery is free.
They add something. The order goes through. On the dashboard, the basket has grown from €50 to €70. It looks like the offer did its job.
For the shop, the result is less obvious. The extra item has a cost. The delivery charge disappears. And the same offer may give free shipping to customers who were already going to spend €70.
A free-shipping threshold pays when the extra contribution it creates exceeds the delivery income it gives away and the extra costs it causes. A higher average order value cannot answer that question by itself.
The arithmetic below is an illustrative model, not a real shop’s results. All figures exclude VAT. The threshold is expressed on the same net basis for comparison; it is not a recommendation for the price shown to consumers.
Why the offer deserves a fair hearing
Delivery charges matter to shoppers. In its 2026 delivery research, DHL reports that 41% of surveyed global shoppers said free delivery would have encouraged them to complete an abandoned purchase. That is a stated preference, not a measured 41% conversion lift. The broader research covers 29 countries; it is not a forecast for a particular European shop. DHL’s delivery findings.
There is also a distinction between an expensive delivery charge and a surprising one. Baymard’s checkout research identifies late-appearing extra costs as a source of friction and recommends making the full cost clear earlier. Removing a charge and explaining it properly are different interventions. Baymard’s checkout guidance.
Free shipping can therefore be a sensible offer. The task is to work out which behaviour it needs to change, and how much that change is worth.
The €20 top-up leaves just €3 extra
Imagine a shop that currently charges €5 for delivery on every order. It introduces free delivery at €70.
Products cost the shop 60% of their selling price. Sending the parcel costs €6. Packing, handling and payment costs are simplified to a flat €2 per order. Those are assumptions for this example, not industry benchmarks. We initially hold order count, returns and acquisition spending constant.
| Per order | Original basket | Customer tops up |
|---|---|---|
| Product revenue | €50 | €70 |
| Delivery paid by customer | €5 | €0 |
| Product cost | −€30 | −€42 |
| Carrier cost | −€6 | −€6 |
| Other variable order costs | −€2 | −€2 |
| Contribution left | €17 | €20 |
The shop sells €20 more merchandise, but buys €12 more stock to fulfil it. That leaves €8. Giving up the €5 delivery charge reduces the improvement to €3.
Contribution is the money remaining after the costs included here. It still has to cover fixed bills and any costs excluded from the model; it is not net profit.
Notice what has not happened: the shop has not incurred a new €6 parcel cost solely because delivery became free. It was sending the original order anyway. With the same parcel and carrier cost, the change is the lost €5 customer payment. Subtracting the whole €6 again would count the existing shipping cost twice.
That changes if the extra item needs a larger box, another parcel or more handling. An additional €2 fulfilment cost would leave only €1 of the improvement. An additional €4 would turn it into a €1 loss.
The customers who do nothing can cost more
Now look beyond the customer who topped up. Consider 100 orders that would have happened without the offer:
- 40 customers would have spent €50 on products and paid €5 delivery. In the example, all 40 now increase their product spend to €70.
- 60 customers would already have spent €70 and paid €5 delivery. They buy exactly the same goods, but now qualify for free shipping.
For the first group, contribution improves by €3 each: €120 gained.
For the second group, product revenue and costs stay the same. The shop simply loses €5 each: €300 given away.
Across the 100 orders, product revenue rises from €6,200 to €7,000. Yet contribution falls from €2,180 to €2,000. The shop sells €800 more merchandise and has €180 less left after the modelled order costs.
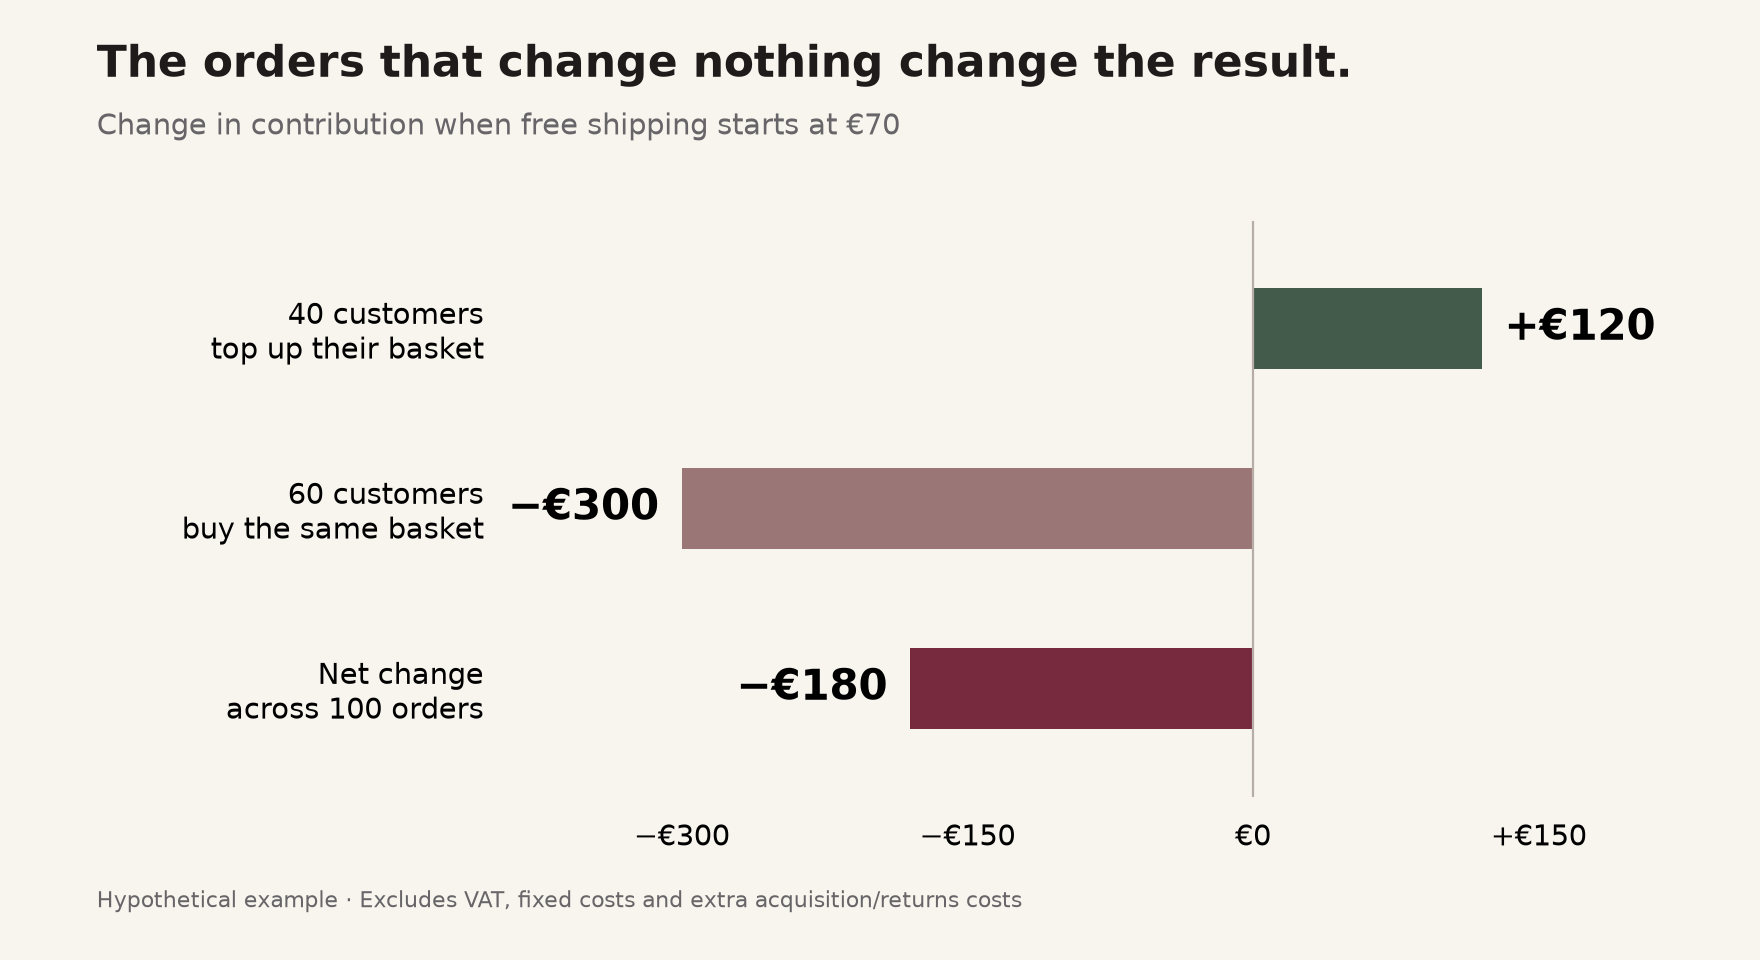
This is the part a basket-growth report can hide. It tells you what customers spent after seeing the offer. It does not tell you what they would have spent without it.
The assumed split matters enormously. With 80 customers topping up and only 20 receiving free delivery on an unchanged basket, the same economics produce a €140 improvement: 80 × €3, less 20 × €5. The offer is not inherently good or bad. Its result depends on how many customers change their behaviour and what those changes contribute.
New orders can make the offer work
The first calculation assumes no increase in completed orders. That is deliberately incomplete: a delivery offer might persuade someone who would otherwise leave to buy.
A genuinely additional €70 order contributes €20 under the model. Nine such orders would cover the €180 shortfall. The tenth would take the shop ahead, before any extra acquisition or return costs.
If each additional order also requires €8 of incremental advertising, it contributes €12 after that advertising cost. The shop would then need 15 additional orders just to cover the shortfall.
The word additional does the work. An order moved forward from next week is not automatically a new sale. Neither is an order from someone who would have bought anyway. Repeat purchases could make the economics better over time, but that benefit needs evidence rather than an assumed lifetime value.
Set the threshold around the next item
One tempting shortcut is to set the threshold a little above average order value. That gives you a number quickly. It does not show whether customers can reach it sensibly—or whether the products they add leave enough money behind.
Suppose a €50 basket needs another €20 to qualify. A useful €20 accessory with a 40% product margin contributes €8 before any extra handling. A €20 item with a 20% margin contributes €4. Losing the same €5 delivery payment makes the second top-up worse for the shop even before additional fulfilment costs.
For an order that would already have shipped, a simple check is:
Extra product margin, minus lost customer delivery payment, minus extra fulfilment and payment costs.
With a €5 delivery charge and no extra fulfilment cost, a 40% margin requires €12.50 of extra product spending merely to replace the delivery income. At 20%, it requires €25. These are break-even top-ups for that one order, not recommended storewide thresholds.
Look at the actual items someone might add. Are they relevant to the original purchase? Do they fit in the same parcel? Are they often discounted or returned? Is the gap small enough to fill with something useful? A threshold can be mathematically attractive and commercially awkward.
Test the policy, not just the banner
Start with your order distribution, not only its average. Estimate how many existing orders already qualify, how many sit just below the proposed threshold, and what plausible top-up items would contribute. Use your contracted delivery and handling costs rather than a public headline tariff.
Then make the customer-facing rules precise. Which destinations qualify? Does the threshold apply before or after discounts? Are bulky products excluded? Show the delivery charge and qualifying conditions before the final checkout step.
Platform settings deserve a test too. Shopify’s documentation says its free-shipping discount minimum counts products at their discounted price when discounts can combine, and excludes taxes and other costs. That guidance concerns the discount feature; check the particular shipping-rate or discount setup you use rather than assuming every rule behaves identically. Shopify’s minimum-purchase documentation.
Where traffic allows, compare the existing policy and the proposed one concurrently with a consistent allocation of visitors. Keep other major changes stable. Agree the test’s duration and decision criteria beforehand, and avoid declaring victory after a handful of good orders.
The main measure should capture both conversion and order economics: contribution per eligible visitor, with the same cost definition in both groups. Inspect completed orders, product spend, delivery income, fulfilment costs and refunds alongside it. Leave time for returns to emerge. A policy that attracts extra low-value or heavily returned orders can look better on checkout day than it does later.
Small shops may not have enough traffic for a clear experimental result. A before-and-after comparison can still be useful, but promotions, seasonality and traffic changes make it weaker evidence. Call an uncertain result uncertain. A short run without a visible loss is not proof that the threshold is optimal.
Before changing the banner, write down two numbers: what a plausible top-up leaves you, and what free delivery costs on a basket that would have qualified anyway. Those two figures tell you much more than a larger basket alone.
Sources and calculation notes
Researched and checked 26 October 2026. DHL and Baymard provide external context; neither supplied or validated the hypothetical shop model. DHL is a logistics provider and Baymard sells UX research and services. Shopify is the source for its own feature rules. No source quoted here demonstrates that this particular threshold will increase profit.
The worked example assumes a 40% product margin; €6 carrier cost and €2 other variable costs per order; €5 delivery revenue before the offer; no change in parcel size, returns or acquisition cost unless explicitly stated. It excludes VAT, fixed costs and unmodelled support/return costs. All scenarios are original Webshop Toolkit calculations, not observed trading results.
The DHL 2026 study announcement describes the wider survey sample. Links above point to the exact delivery, checkout and platform guidance used.
Related: The discount trap examines why more orders after a price cut can leave less money for the bills.
Join the free weekly briefing for ecommerce news and original explanations from Webshop Toolkit.